Advanced SQL for Data Analysis and BI
Acquiring SQL knowledge is pretty imitating while working with business intelligence. I have been working on data analytics and data science for quite some time now. I have learned that some advanced SQL knowledge really comes in handy; while doing the other tasks in BI. In this article, I am going to show some techniques on how to use SQL to analyze the data. I have used an opensource database named “mavenfuzzyfactory” and the ER diagram would look like this:
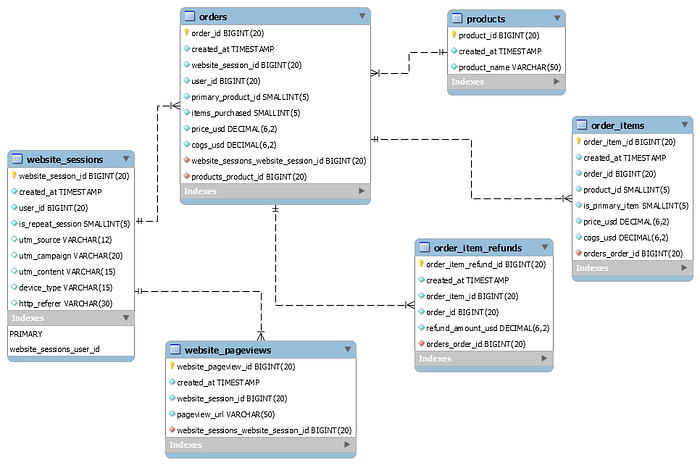
The dataset and the following questions are taken from the assignments of a course that I have taken. Remember, I had to try multiple times to get them right. Therefore, if you want to try, then use the SQL queries to load the dataset and try to solve by yourself first. Let’s start with something simple. We often face an error that says that “that database is not selected or this table doesn’t exist” Even though you have them! That brings us to the first use case of “USE”!
-> USE
Solution: “USE database_name”
Output: The keyword USE will import the database name in your system and you don’t have to use that name all the time rather you can use the desire table name!
Another way you can set the database as the default:

So in the above database, A business concept would be traffic source analysis to understand where the customers are coming from and which channel is diving the highest quality traffic! You would probably guess that we are going to be using the website_session, website_pages, and orders table!
Let’s look at these tables first, shall we?


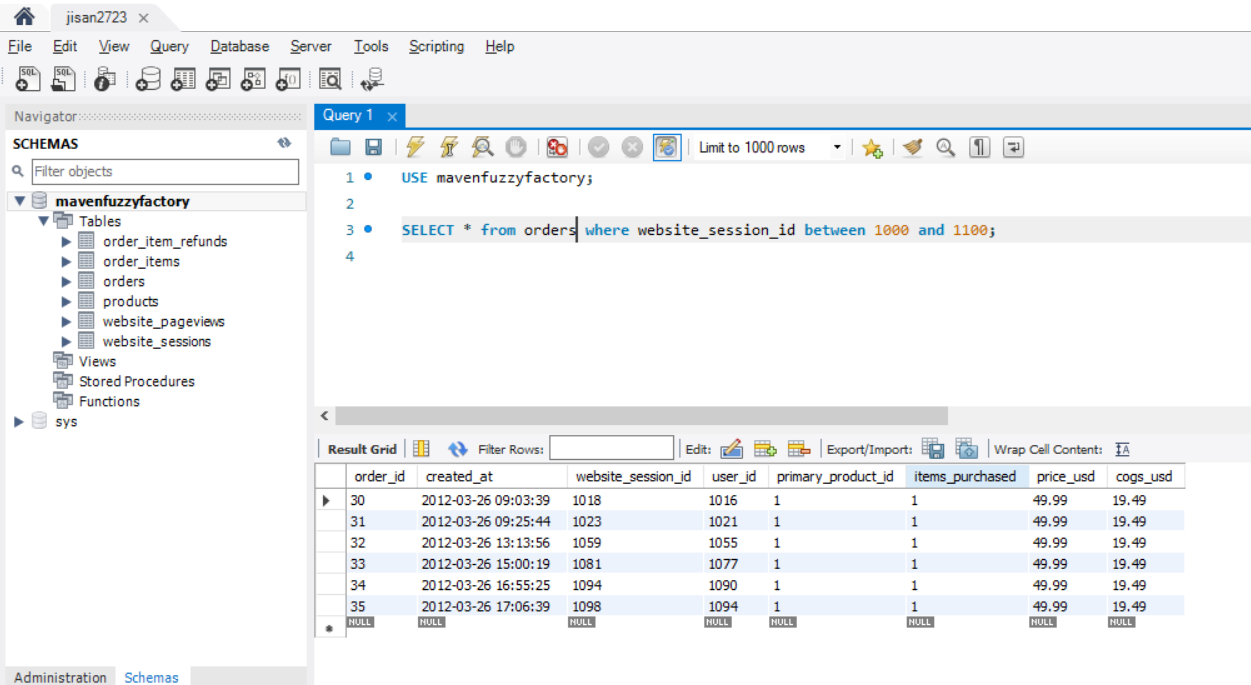
Q1: Find the top traffic sources (utm_content) with aggregated sessions, orders, and session to order conversion rates?
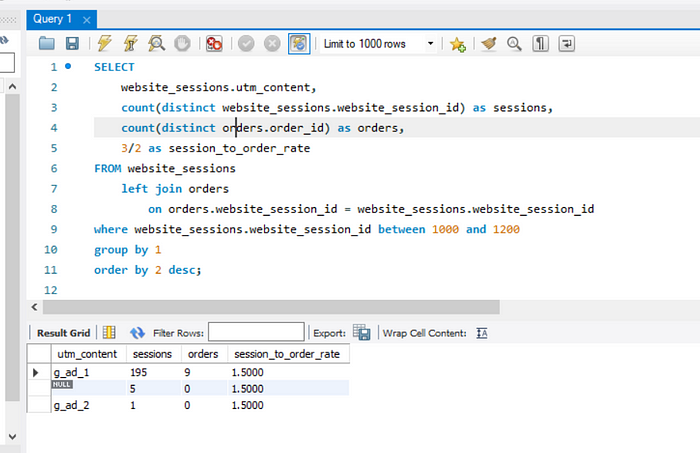
In the above code, we have found the top traffic sources with the highest session and orders along with conversion rate from session to orders. Now, in the code, you can see that we used 1, 2, and 3. Those actually denote the selection rows which start from 1…N!
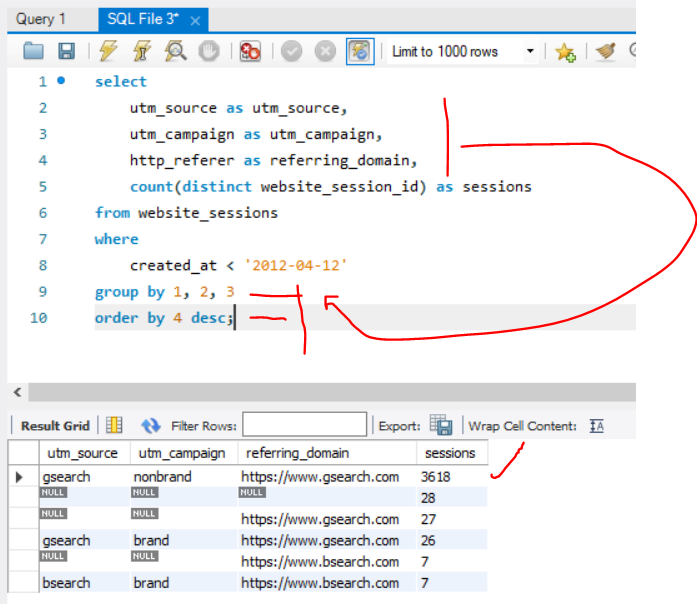
Q2: Help me understand where the bulk of our website sessions are coming from, through yesterday (current date: April 12, 2012)? Please break it down by UTM_source, campaign, and Referring domain!
Q3: Could you please calculate the convertion rate (CVR) from session to orders based on gsearch and nonbrand which is our major traffic source?
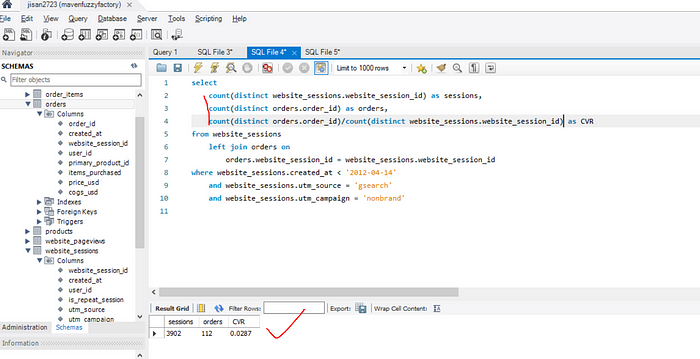
Remarks: We need at least a CVR of 4% to make the numbers work. Otherwise, we need to reduce bids. And if the CVR is more than 4% then we need to increase the bids!
Use case: CASE & When?
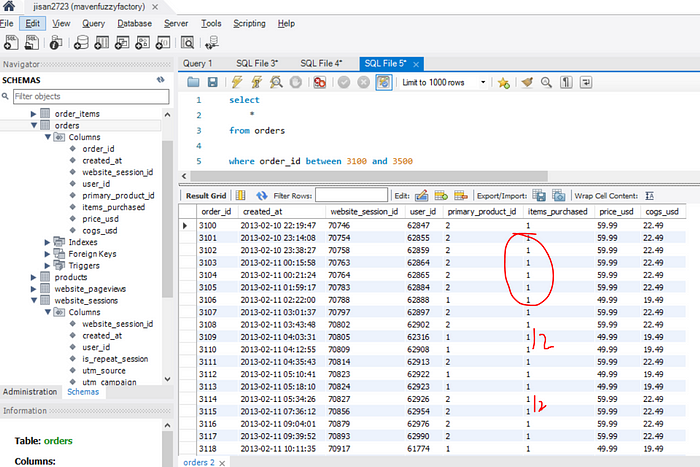
We will be figuring out, how to find which orders include 2 items and which orders include 1 item!
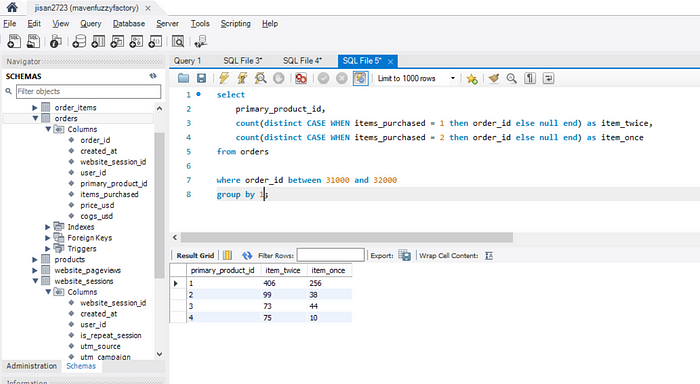
Q4: Can you pull gsearch nonbranded tended session volumne by week to see if the bid changes causes any volumne drop?

Q5: Can you pull convertion rates from session to orders by device type (mobile, and desktop) for gsearch and nonbrand?
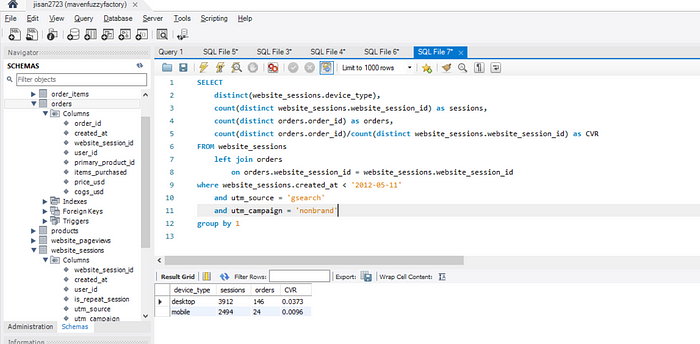
Q6: Can you pull weekly trends for both mobile and desktops so we can see the impacts on volume based on gsearch and nonbrand?

CREATE TEMPORARY TABLE:
Creating temporary tables to hold the data on which a query can be applied! We are going to be working with website performances. Therefore, from the look of the database, we should start with “website_pageviews”!
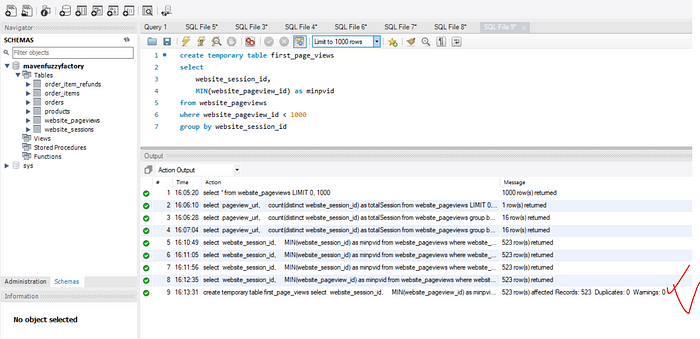
Now that we have created our first temporary table, let’s get to the questions again.
Q7: Could you help me by pulling the most-viwed webpages ranked by session volumes?
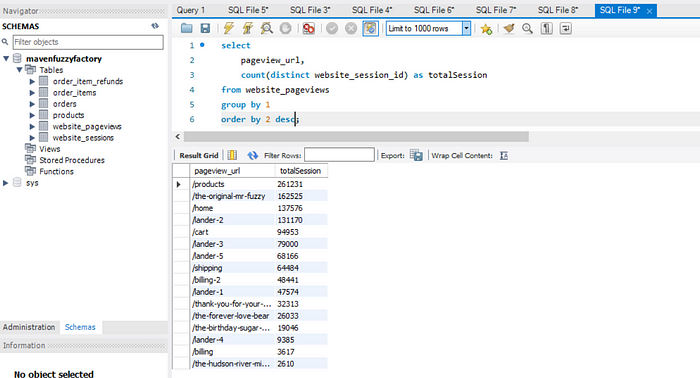
Q8: Would you be able to pull a list of the top entry pages and rank them on entry volumne?

Q9: We saw that the home page is the highest landing page. Can you pull the bounce rates for traffic landing on the home page based on total_sessions, bounced_session, and bounce rates? Obviously bounce means user only hit 1 page view and left!
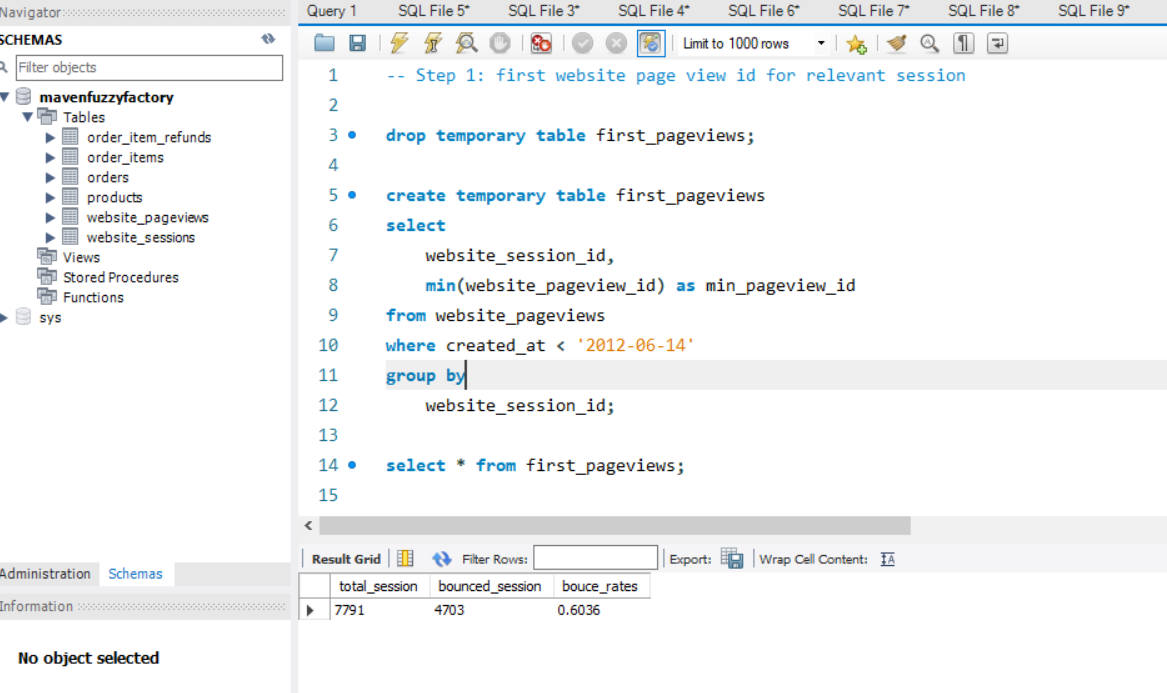


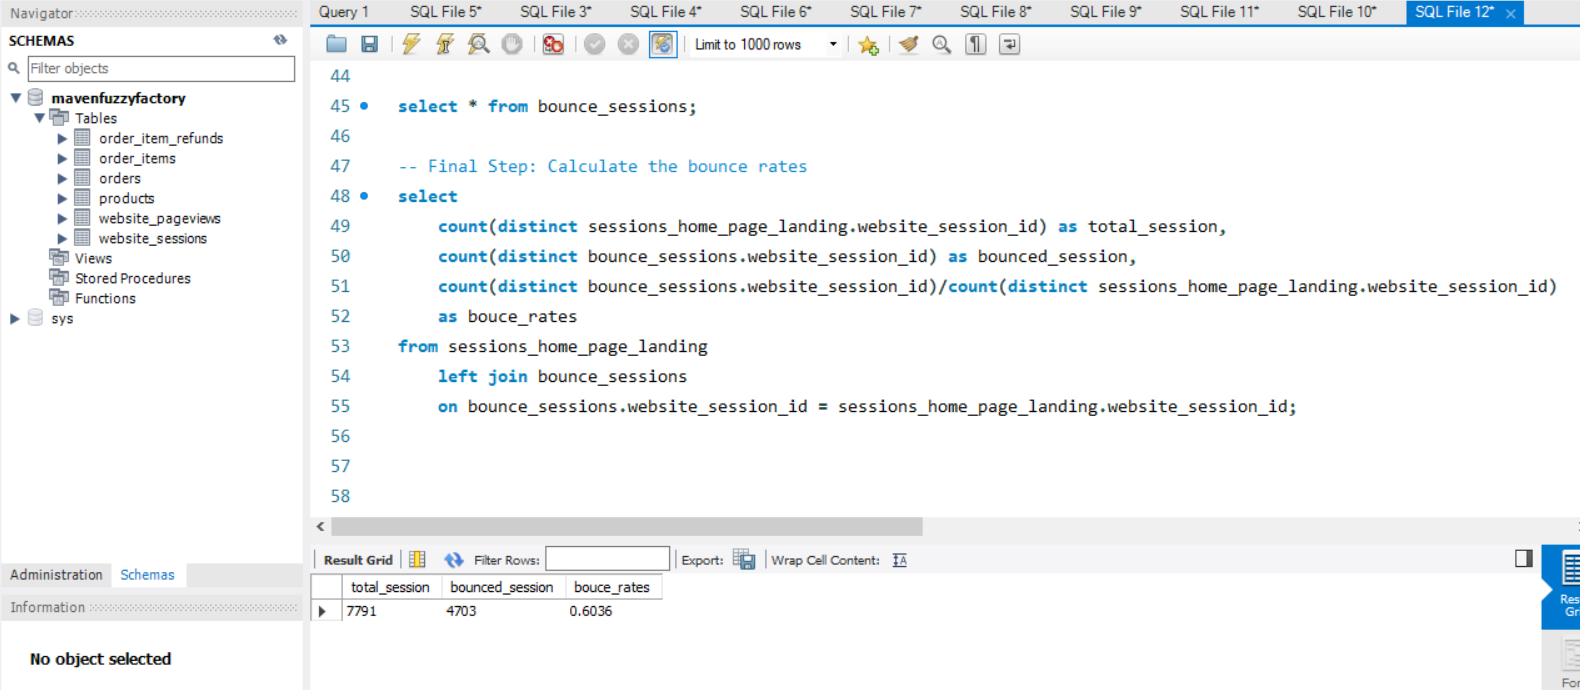
Q10: We ran a new customer running page (/lander-1) in 50/50 test against the home page (/home) for our gsearch nonbrand traffic. Can you pull bounce rates for two groups so that we can evaluate the new page? Please consider the time period where the /landing-1 getting the traffic.


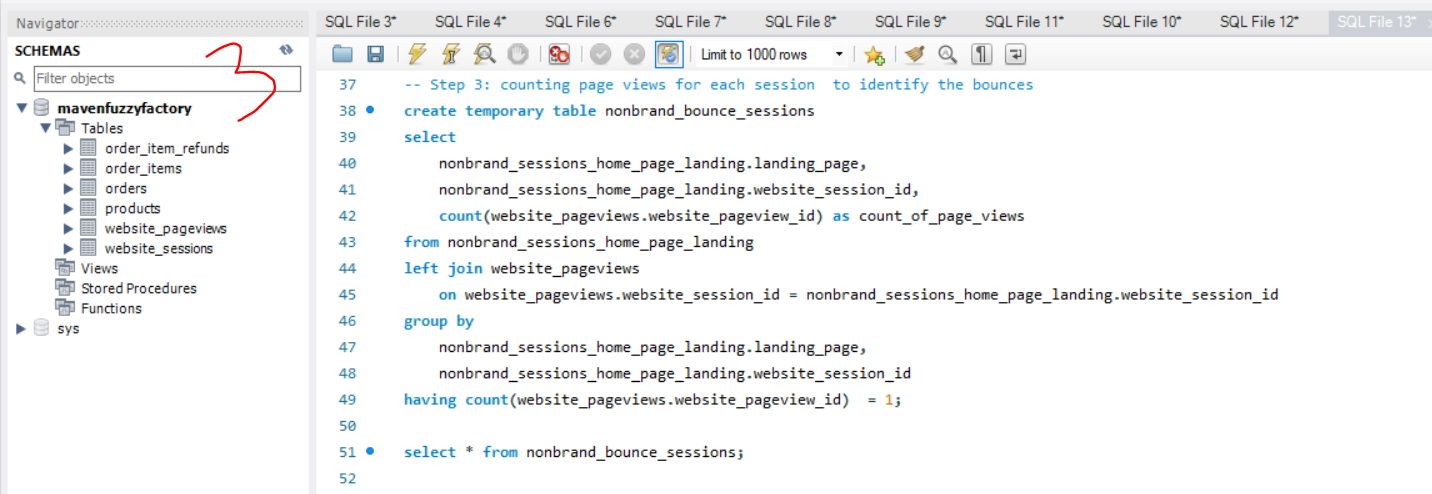
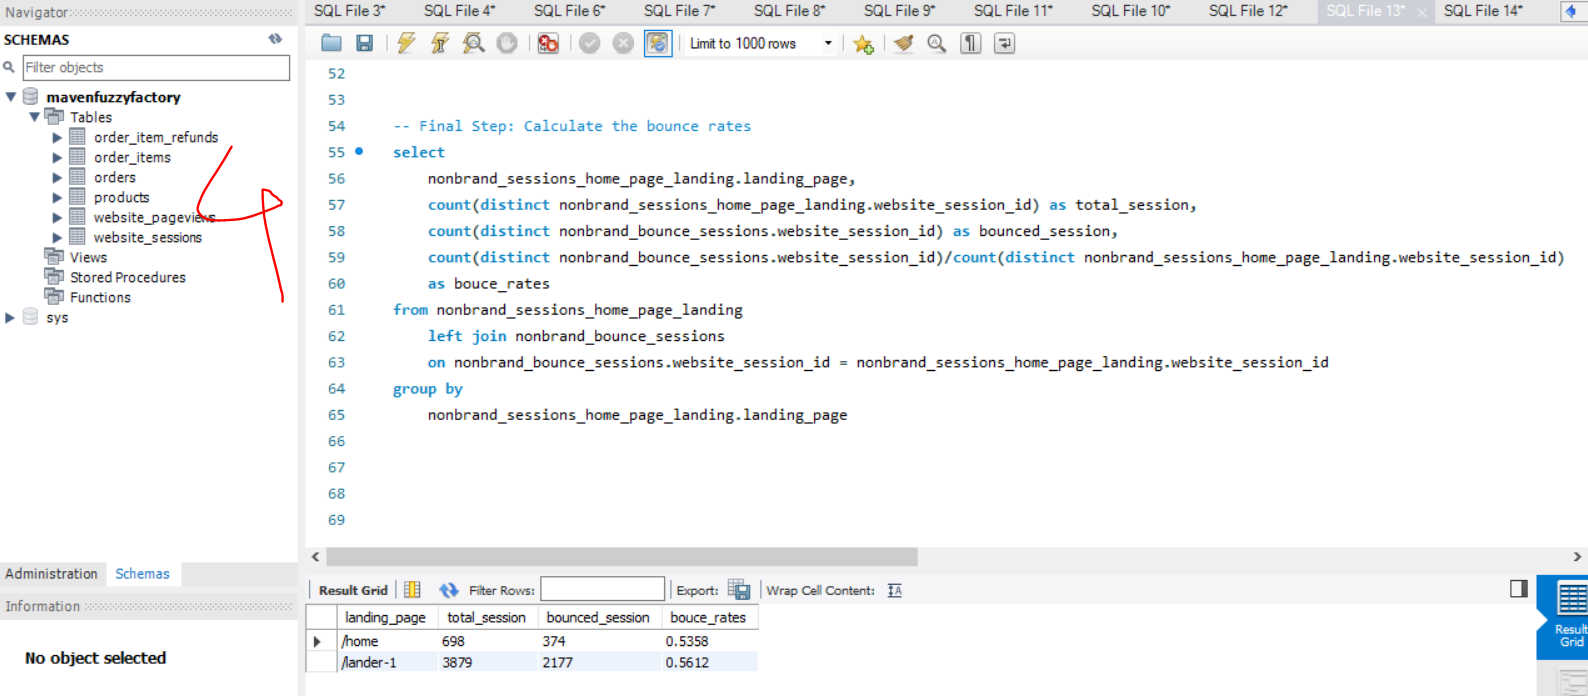
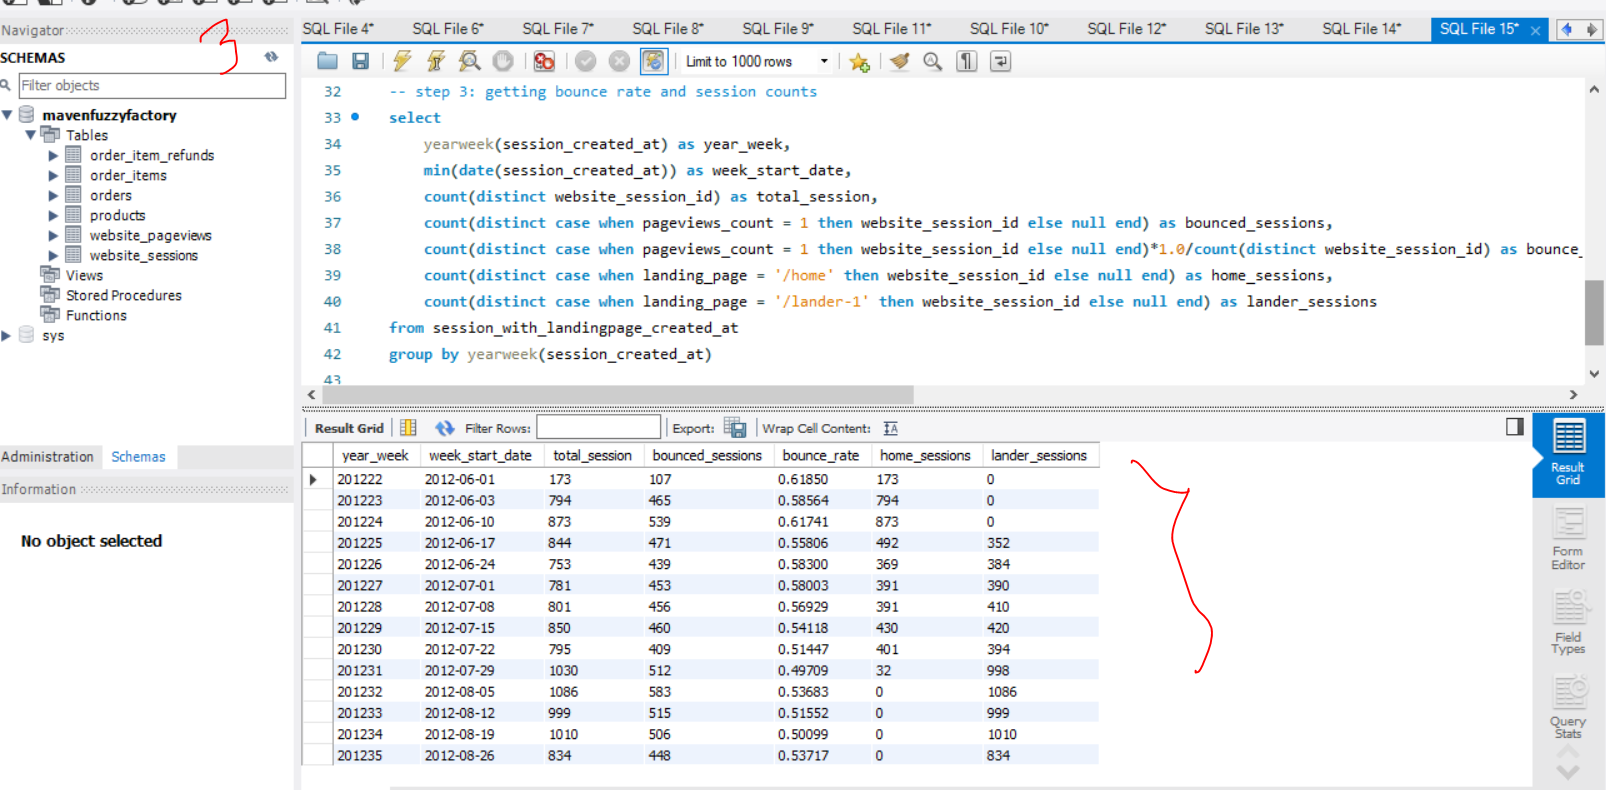
Q11: Could you pull the volumne of paid search non-brand traffic landing on /home and /lander-1, trended weekly since June 1st? Could you also pull our overall paid search bounce rate trended weekly?


Conversion Funnels: building a mini conversion funnel from /lander-2 to /cart and to see how many people reach each step, and also dropoff rates.
This needs some certain steps to complete:
- select all page views for the relevant session
- identity each relevant page view as the specific funnel step
- create the session-level conversion funnel view
- aggregate the data to assess the funnel performance
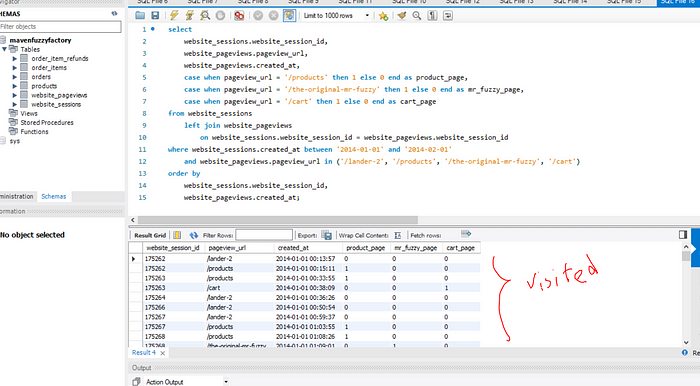
In the above example, we can see that some users landed on the product page, and/or mr-fuzzy-page, and/or cart page. We want to see explicitly which users went to how many pages on our website. I am going to use nested SQL subqueries!

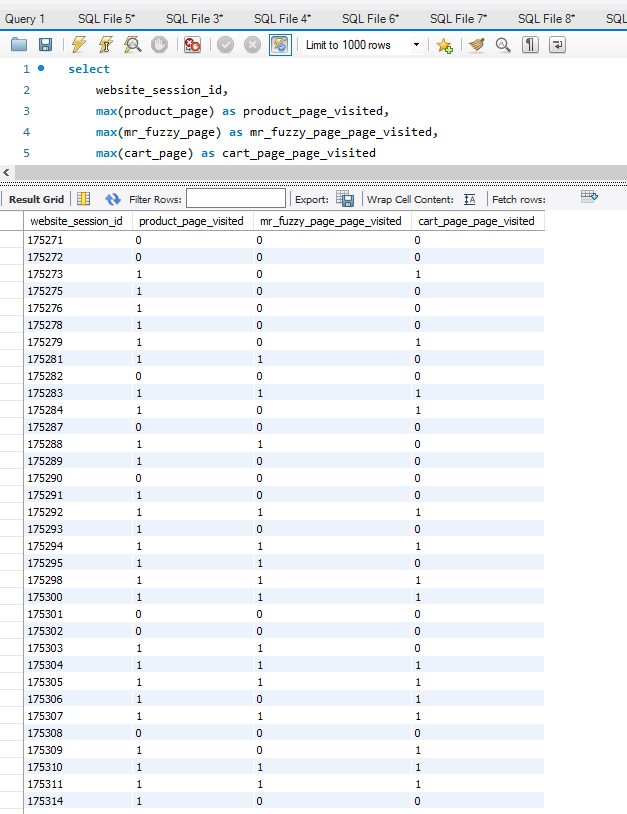
Now, we would like to see how many sessions actually made it to each page!

From the above results. you can see that out of a total of 10645 sessions, 7791 made it to the product page whereas 4781 made it to Mr fuzzy page and 2888 to the cart page! We can also see the same output in another way, which is the percentage!
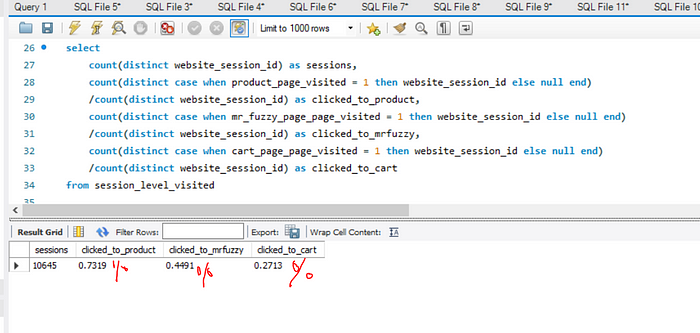
let’s see one more conversion funnel example, which is really important in an e-commerce based companies!
Final Q: Can you build us a conversion funnel, analyzing how many customers make it to each step? Start with /lander-1 and build the funnel all the way to our thank you page. Please use data since august 5th.

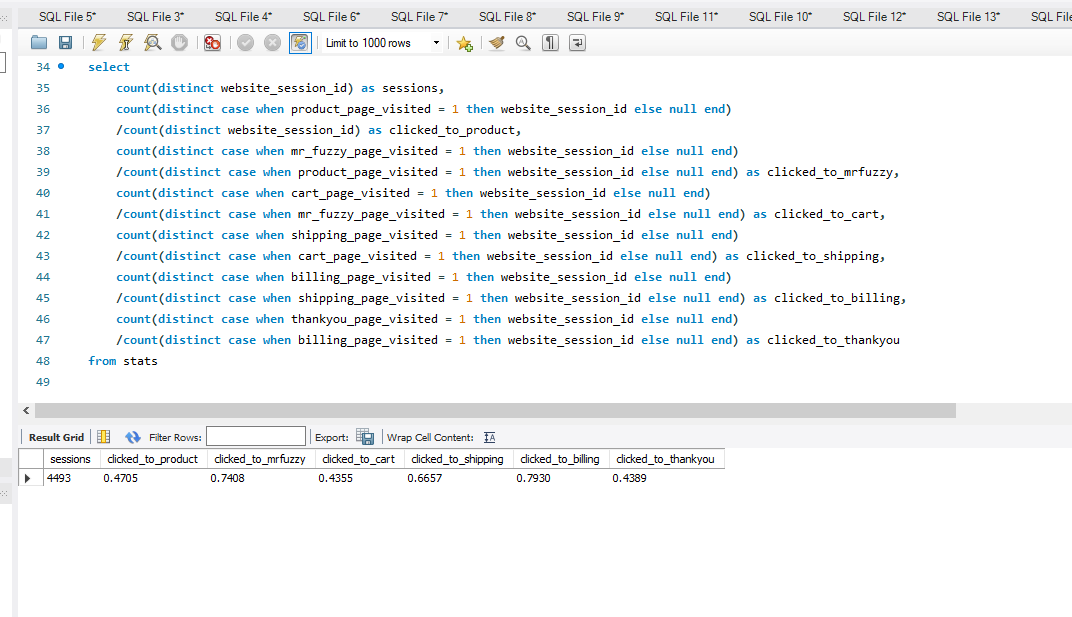
Look at conversion funnel analysis on the above example for certain criteria! From the look of it, the product page, cart page needs to be focused on!
These are some advanced SQL hands-on for data analysis and business intelligence purposes! That’s it for today! I will write another article following up the same data! See you next time! 👌